
IT Audit – How the score is calculated
The IT Audit score provides an overall measure of the health of your environment. As outlined in the main IT Audit page, we wanted a method to quickly illustrate the state of their IT without having to worry about understanding the technical mechanics.
Rather than stating “It’s a score out of 100”, here’s exactly how it’s worked out:
The Audit Setup
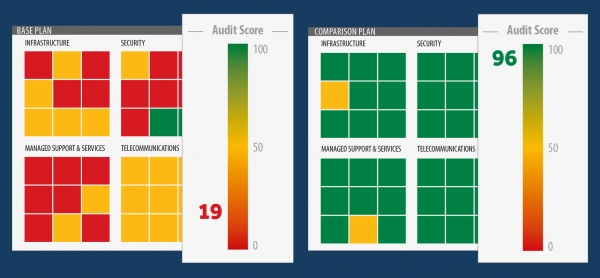
Each IT Audit is made up of four key areas or quadrants. Three of these are mandatory which include Infrastructure, Managed Support & Services and Security. Depending upon whether it’s relevant to you, and it is to most people, we also undertake a review of Telecommunications.
The three primary quadrants: Infrastructure, Managed Support & Services and Security form the basis of the IT Audit Score. The reason for this is that for the score to be consistent across customers, the points of reference must also be the same. Given Communications is an optional assessment, we score this independently.
Each quadrant is made up of nine audit items, which we select from a standard list we’ve built up over time, but that best allow us to gauge your IT given your specific business setup. Each item is given a relative weight on a scale between one and five, depending on the importance to your organisation.
For example, Backup & Disaster Recovery may represent five out of five, but something like Cabling may only represent 1 out of 5.
The weighting is used to calculate the overall IT Audit score.
The Audit Process
During the audit, each item is then scored based on our assessment of your compliance with industry standards as well as the weighting you provided earlier in the pre-audit discussion.
Each item is assigned a numeric value, during the audit, using a colour scoring system. Red equals 0, yellow equals 50 and green equals 100.
To get an overall potential score for your IT Audit, we calculate the highest score for each item by multiplying by its weighting.
Next, each of the individual items actual score is then calculated by the score given to it during the IT Audit and multiplying this by the weighting.
So now for each item we have the Highest Potential Score and the Actual Audit Score.
At the end of the audit, each quadrant is totalled by Highest Potential Score and Actual Audit Score, by adding up the individual item scores.
Then the simple maths of:
Actual Quadrant Score / Highest Possible Score x 100 = Audit Quadrant Score.
By doing this, we are able to provide you a score that really is specific to your business.
