
Guest Blog: Successful Business “Drivers” need a Dashboard!
I was sat at a desk today in the heart of Soho in London, chatting with the CEO of a business I am currently doing a Process Improvement project for, and as he offloaded a little about how difficult it was to find out what was really happening with his business, it suddenly it hit me how much I missed the analytics dashboard that I had in my last permanent role, and it got me thinking about what a difference it made to how I ran my Directorate.
Fast forward to later that day, as I was driving home from the station, it got me thinking about when you’re driving a car, how much do you really use the dashboard? Could you drive the car without all those dials and lights? Would it really make THAT much of a difference?
Well you know where the ignition is to start the car, you know where the pedals are and the gears, you don’t need a flashing light to tell you how to steer, or when to change gear. So all the basics are the same whether there is a dial or not.
But what about petrol? Would you know when you were getting low without the little red light flashing at you? You could try to remember when you last filled up, then look at the mileage you’ve done, but then hang on, you don’t have a dashboard with the mileage on, so you would have to keep a really accurate record of how many miles you’ve done, or just fill up every time you pass a petrol station! A little time consuming perhaps…
Then what about sticking to the speed limit? You could let other drivers be your guide, and trust that they are behaving themselves, but on a motorway that’s probably a dangerous game to play these days!
So I’d broadly conclude that yes, it’s definitely physically possible to drive your car without your dashboard, but you would have to compensate for a lot of things, counting the miles to keep the petrol topped up, and taking risks with your speed, and the whole experience could potentially be a lot more stressful than it should be.
So back to the analytics dashboard…driving the car could be compared to running a business without the right analytics. Yes it can be done, but it’s a lot harder to do, and definitely a LOT more stressful, and whilst you may have a pretty good gut feel for what’s going on, it’s difficult to really pinpoint where you need to focus your energy when things aren’t going to plan.
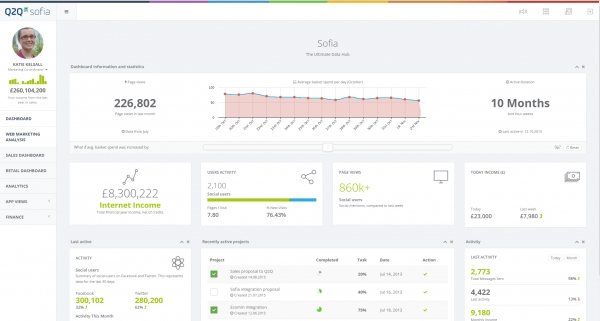
The dashboard where I last worked was created by Andrew Stellakis and his team at Q2Q. Ok yes, I confess, that was a shameless plug for my husband’s talents, but hey, it was a seriously cool dashboard so blatant plugging will continue!
I ran the Operations team, so an example of my favourite page was the workload in the warehouse. I could see a top level view of exactly what was ahead of them, what was in pick, and what had been invoiced so far that day. My favourite little bar chart was the number of Internet orders yet to be picked, and how many days old they were. So if the majority were just a day old, then it was high fives all round, whereas if things were slipping and the bar for two days, or three days was creeping up then it was a quick motivational team talk, or a large box of jam doughnuts for a sugar boost to get the team revved up and whizzing round the warehouse!! Just kidding of course, I’d bribe them with bacon rolls, we’re talking about real men here!!
The front of the dashboard gave a top level view of the entire business, sales to date for the financial year, the outstanding order book, and therefore the % of the yearly target potentially already “in the bag”. This could be drilled down to range level, or country, or even customer if you really wanted that level of detail. There were other tabs such as key milestones for projects that could be manually updated, and really sexy stuff like number of debtor days… yes I am being sarcastic, I am a geek but not THAT geeky!! There were charts to show you how the order book was building vs the same point last year, and daily updates for in season repeat orders to measure how we were doing against the target, and give us a measure of how well the product was selling through in our customers stores.
In a nutshell, all the key drivers were there, with warning lights, dials, graphs, and bells and whistles of course! All of which would tell you either “things are ok” or point you in the right direction of where to look if things weren’t running smoothly. A quick look (make that fix!!) first think in the morning would set me up for the day, then a few cheeky glances throughout the day in busy periods to check that the warehouse were on track.
Ahhh…. I really do miss those charts and graphs! Definitely a key requirement for driving the business with more confidence and less stress, just like driving the car! I know I would much prefer to “drive” with my dashboard there. Do you have a great dashboard to drive your business? If not then Google Q2Q Sofia and see if it looks like something you could use…
Shameless plug complete!!
Lorna Stellakis – A woman on a mission to help as many people as possible to look up from their shiny screens and really connect with their co-workers (or whoever is around them that day) so that they can collaborate, learn from each other, become more productive, more efficient, and figure out what will make their day really great!! If you really look, the world is a lot shinier than those little screens… Look me up on LinkedIn or drop me a tweet @LJS_LORNA
